1. Run any Oracle APEX 4.2.3 environment, and if you don't have get a free one here http://apex.oracle.com
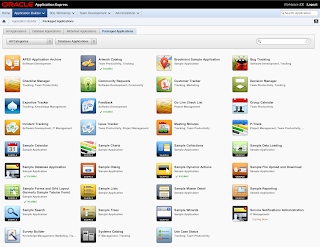
2. Click application builder, then create application, then packaged applications, then choose data reporter:
3. Install the application and run it. Installing can take a minute or more.
4. From the Data Reporter home page click the New button
5. Choose the type of report you wish to create, my favorite is the Filter Report, so I will choose one of these
6. Give the report a name and category. Color coding the category allows you to locate you report more rapidly on the home page.
7. Now for the important part, define your query. Administrators of the application can set up canned data sources. I simply selected "Top Cities" and it pre-populated the SQL. I can edit the SQL or enter new SQL. The theory is that SQL not that hard especially if you start from an existing query. For security each table accessed must be pre-defined by the application administrator by adding it to the "Whitelist".
8. Since this is a filter report, I need to determine which columns I would like to filter on. For this data set I choose to provide filters for country, sources, and continent. I also adjusted format masks. I only really need to select one filter and I can simply edit my report later.
9. Thats, it I confirm my report and I am good to go.
10. After creating the report immediately runs. I click the filters I wish to have; in the example below you see largest cities in Europe and North America from selected sources.
11. I can edit my report by clicking on edit. Each time the SQL is changed it is revalidated. I can manage access control, view history of when the report was run and changed etc.
12. Clicking the star icon, favorites the report, making it easy to find the reports you are interested in
13. Navigating back to the home page I see my new report, and it can be run by anyone with access to the application. Of course I have the option to restrict access. This allows reports to be timely addressing what is needed today, and can be removed if. You can filter to show your reports, favorites, specific groups etc.
You can follow the same process to build dashboards, interactive reports, calendars and even PDF printable reports. Hopefully this brief introduction will ease the burden on application developers to create lots of reports an effort to anticipate what end users will want in the future. Now end users can, or at least the SQL Savvy ones can get their data self service.


